Close

December 11, 2023

Portfolio Explorer

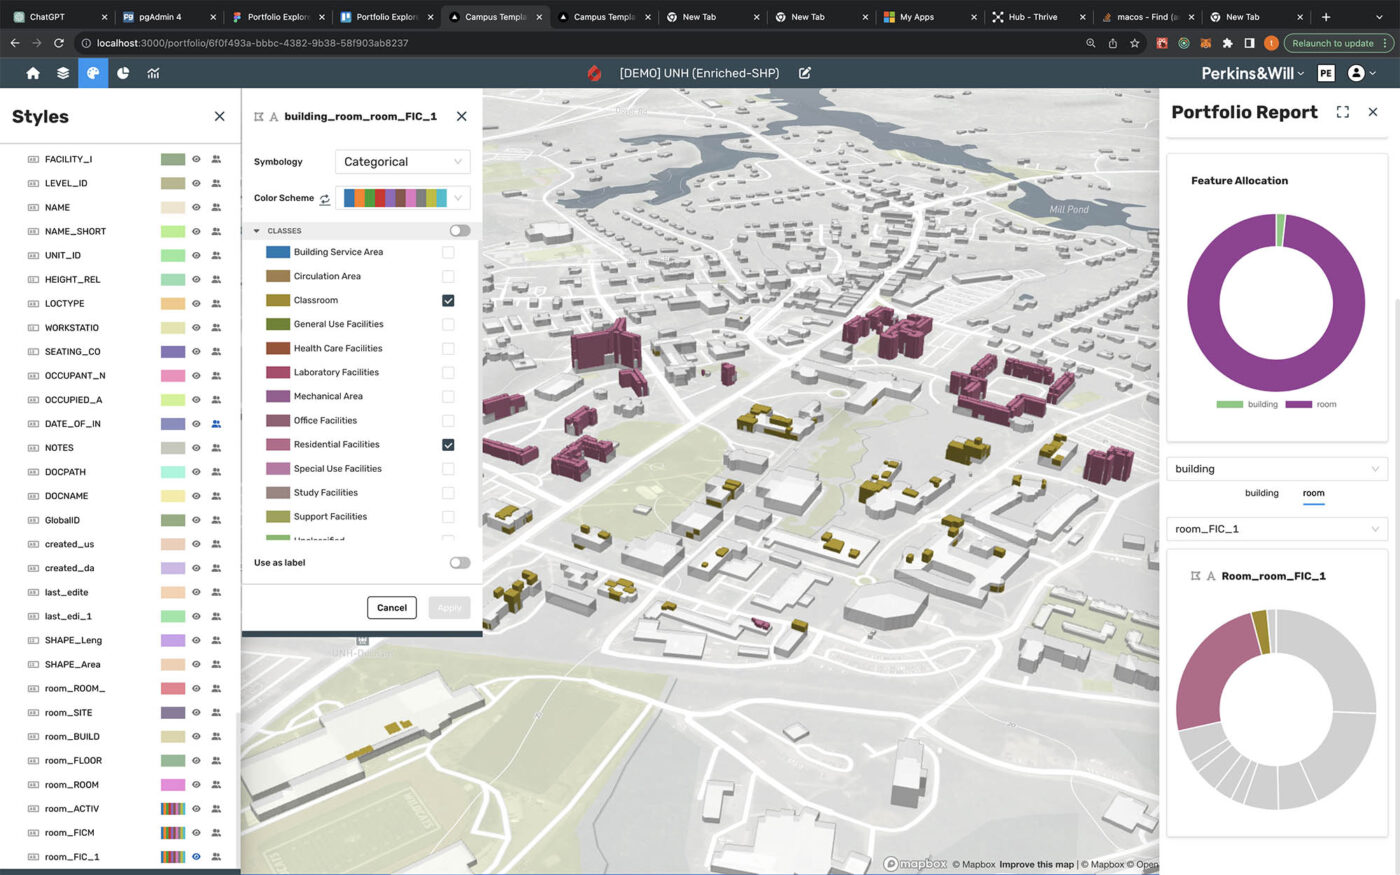
Creating data driven maps used to require experts your team might not have, now you can see your data visualized in the map with a only a few clicks. Thematically render your data with numeric and categorical styles for quick control of synchronized map and chart based visualization.

Tech-Stack

  • React
  • Redux Toolkit
  • AWS Amplify
  • Next.js
  • Deck.gl
  • Nebula.js
  • React-map-gl
  • Recharts
  • Turf.js
  • Ant Design
  • Lottie

Team

  • Thomas Kearns, Digital Innovation Strategist 
  • Alek Shnayder, Software Engineer 
  • Chan Youn, Software Engineer 
  • Aprameya Pandit, Data Scientist 
  • Brad Rogers, P+S Senior Consultant
  • Ellen Berglund, UX Designer
  • Elizabeth Michals, Senior UX/UI Designer
  • Anshika Saxena, UX Designer